

Understanding your total body composition scans
Total body composition scans
Total body composition scans are a quick and reproducible way of gaining an accurate measurement of lean muscle, body fat and bone mass.
Your report includes colour coded images demonstrating body composition. It will also provide regional analysis and comparison of arms, legs and trunk to assist with tracking of change.
Your results
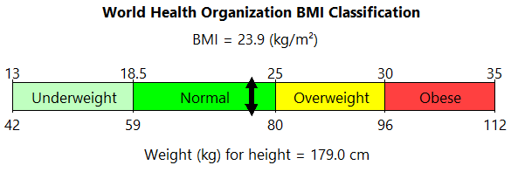
Body Mass Index: BMI is widely used to classify obesity. It is a measure of excess weight, not excess fat, and its association with clinical obesity may differ by gender, age and ethnicity. BMI cannot distinguish between fat and lean tissue.
Your result:
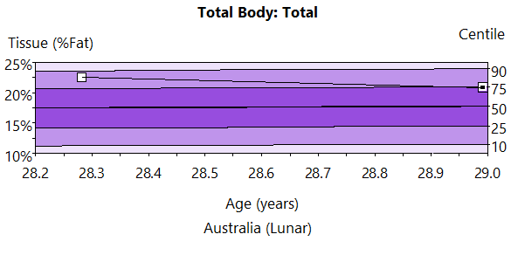
Total Fat Percentage: This displays fat mass as a percentage of total tissue mass. This value can be compared to reference populations. The graph below compares your result to the population of Australia.
Your Result:
FMI: An index of total fat mass that is height independent (total fat mass / height)
Your result:

RSMI: This value represents the relative amount of muscle in the arms and legs.
Android Fat Percentage: This calculates the fat percentage in the lower abdominal area of your trunk. Ideally, android fat tissue percentage should be less than your total body fat percentage.
Gynoid Fat Percentage: The area around the hips, upper thighs and buttocks regions of your body. It’s not necessarily unhealthy but is one area where we as humans naturally store excess fat
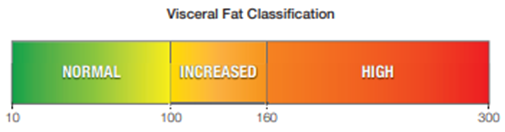
Viseral/Subcutaneous Adipose Tissue: VAT is a specific type of fat that is associated with several types of metabolic diseases such as obesity, metabolic syndrome, and type 2 diabetes. CoreScan results have been validated for adults between ages 18 – 90, and with a BMI in the range of 18.5−40.
Your result:
Lean Mass Percentage: includes all soft tissue parts of the body (organs, muscle and fluids) but excludes body fat and bone. The higher the lean mass percentage, the more muscular the body is.
Lean Mass Index: a measure of total lean mass that is height independent. A useful measure for nutritional assessment.
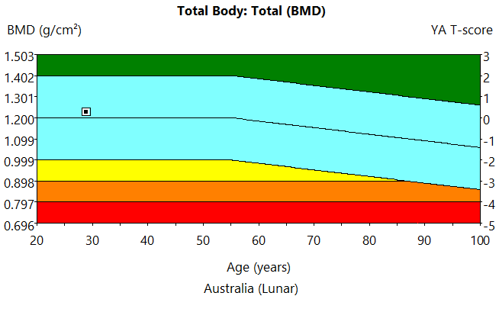
Total Body BMD: Total body BMD is compared to the ‘Young Adult’ average peak bone density (T Score). It is also compared to the results of people of your same age, called ‘age-matched’ displayed as your Z Score.
Your Result:
RMR: An estimate of how many calories are burned at a resting state and represents the minimum amount of energy needed to maintain body temperature, heartrate and respiratory rate.
Further reading
Dual Energy X‑Ray Absorptiometry Body Composition Reference Values from NHANESKelly TL, Wilson KE, Heymsfield SB (2009) Dual Energy X‑Ray Absorptiometry Body Composition Reference Values from NHANES. PLOS ONE 4(9): e7038. https://doi.org/10.1371/journal.pone.0007038
Practical and Technical Advantages of DXA Visceral Fat Assessment Compared with Computed Tomography Thomas L. Kelly, Senior Principal Scientist Hologic, Inc
PIS: BMD 02 | Version: 2 | Updated: September 2026